Reflection
Being from a humanities background, with minimal coding and statistical experience, I was a bit frightened by the almighty “R”. However, when learning what R was and how it is used by many to illustrate narratives through statistics, I was immediately hooked to the stories that can be used to talk about what I interact with through numbers. With the helpful patience, wisdom and guidance of my professor: Rohan Alexander, I was able to warm up to the idea of coding, more specifically R, and I am forever grateful. Rohan’s class was called: INF312: Telling Stories With Data. Being an avid reader with a passion for stories, I had decided to leave behind my fears and worries with coding and get my elbows dirty by wrangling R and using R as my medium to generate stories about the world through data. But this course also taught me valuable lessons and gave me some interesting insights into what is in store for my future, as I now have a new skill in my so-called toolkit to unpack and apply to the world around me in my future endeavors. From being a bit afraid of R to now creating my digital portfolio using R, precisely the distill packages show the kind of growth I had as a student. But it is not just R I got to play around with. I also learned about Github and how amazing it is as a resource and repository for work.
Samples with R
Over the winter semester, I had found a silver lining between narratives of my work produced with my introduction to R. This connection was entirely by chance. Still, it speaks volumes about what I am most curious about, Family Dynamics.
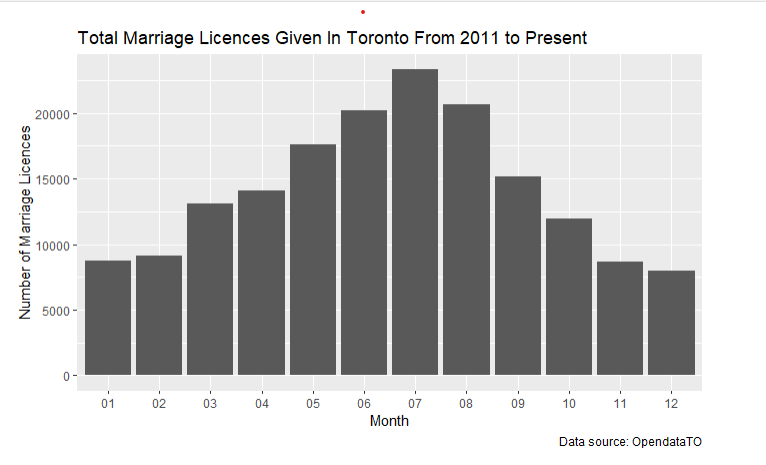
The progression first report started out with Marriage. I tried to get a glimpse of the number of Marriage Licenses given out in Toronto at a particular month, trying to see if there could be a conclusion to be made; the short answer is yes, but to really see, check out the Tieing The Knot In TO.
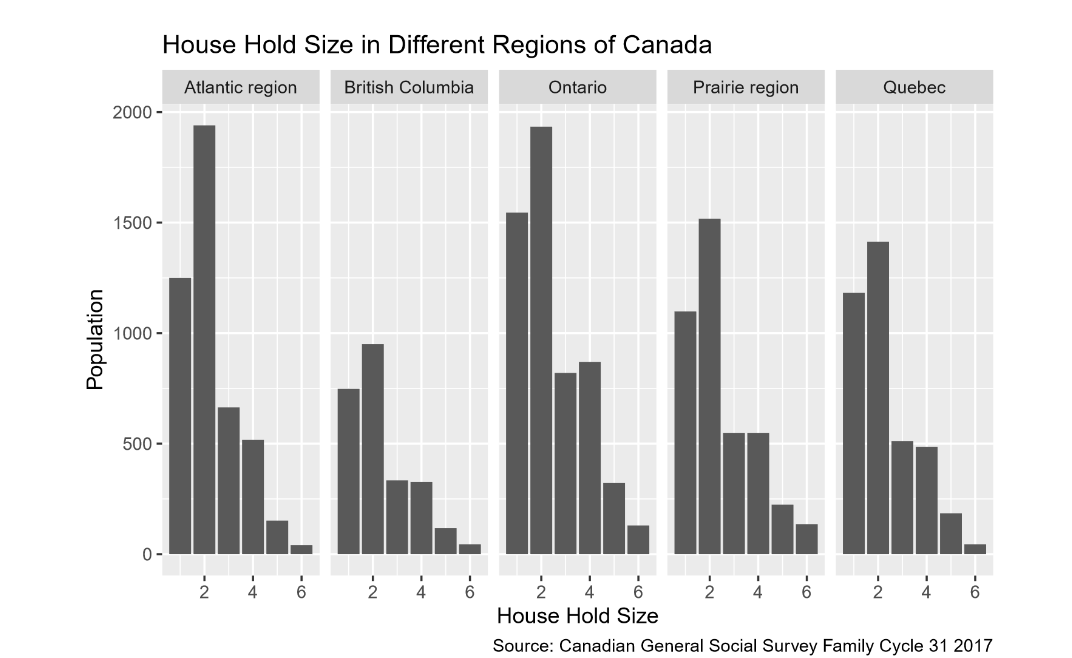
Moving onto the second report, I was able to work with Benner Feng and Elizabeth Yao Tong The three of us looked at the Canadian GSS Family Cycle 31 Of 2017. Through the numerous categories and the sheer about of data provided by CHASS (Computing in the Humanities and Social Sciences), Data Center has partnered with many institutions to allow students from many disciplines to access data and interpret our world through data. The basis for the report was trying to capture any trends within the Canadian Family and try to write a narrative on our findings through the data gathered. To see our total findings and narrative, check out Capturing the Happy Family.
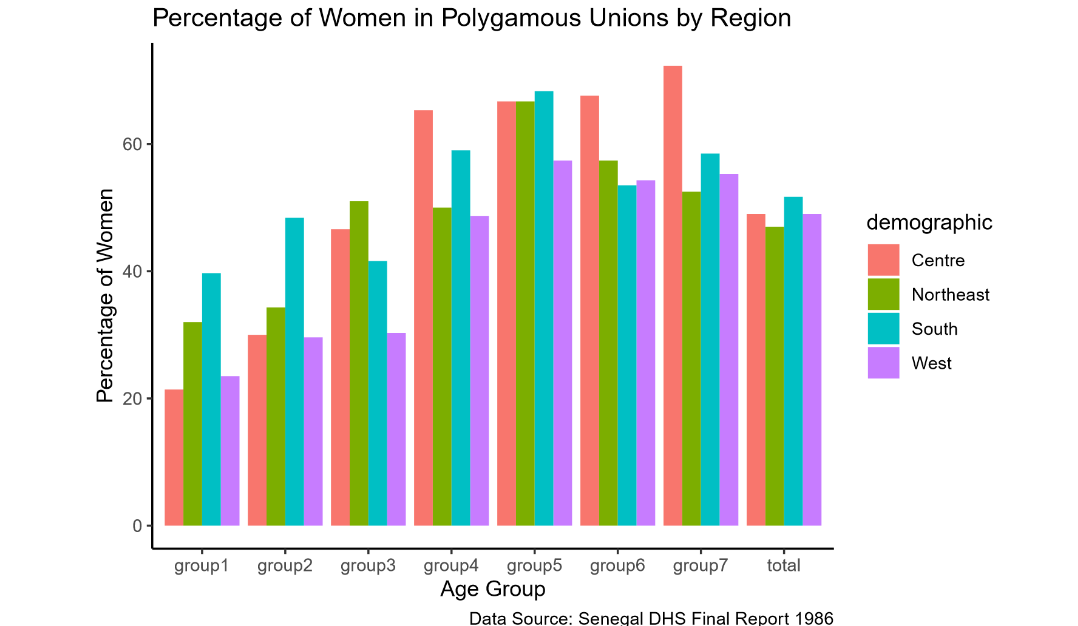
The final report for the class I had wrote about Polygamy in Senegal during the 1980s. The idea for this report was to link the story, So Long a Letter by Mariama Ba, more specifically about the main character’s attitudes towards polygamy with the data from the Senegal DHS 1986 to give some context to why the author of the book was writing about polygamy the way she does, check out So Long Polygamy.
Future Hopes
With my new found appreciation for R, I am confident my curiosity and sheer enthusiasm for stories will be forever impacted. Now I can use data to touch on topics I was initially scared to look into, like statistics, math and finance. But I also see there is a whole new side of using R with the ideas I am a bit more familiar with and see if I can use the data collected and gathered as a way to speak to a broader audience or to a reader who has different interests and background knowledge than me but still gather the messages I try to put out with my future works. Either way, I think this class really changed how I view information, data, and knowledge.